
University Senior Lecturer in International Macroeconomics Michael Kitson dissects the UK Government’s own assessment of its economic performance
 The Chancellor of Exchequer, George Osborne, presented his Autumn Statement to the baying and snarling cauldron of the Mother of Parliaments. It is not easy to disentangle a real vision for the British economy amongst the rattle and hum of such a fractious gathering. But looking at the evidence suggests that the Statement may be good politics and help the Government (in particular the Tories) to win more sets at the next election. But it is not good economics – there was some window dressing but nothing to suggest that the structural flaws in the British economy are being addressed.
1. Is the plan working?
The Chancellor opened his statement with the assertion that: ‘Britain’s economic plan is working’. The evidence for this seems to be recent increases in economic growth: which is expected to be 1.4% this year and is forecast to be 2.4% next year. A return to growth is welcome but it is weak and has been a long time coming. In normal times, growth should be between 2 and 3% per annum, and when rebounding from recession, growth should be between 3 and 5% per annum. Also, as the chart below shows, the recovery from the recent recession has been the most sluggish for a century.
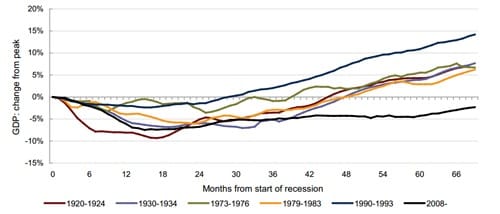
Source: NIESR (2013), NIESR, Estimates of monthly GDP, 6 November, 2013
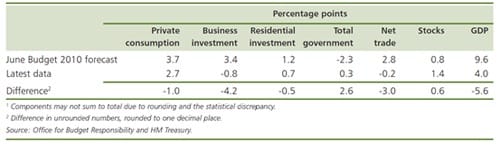
The failure of Plan A is apparent in the evidence buried in the report that accompanied the Autumn Statement. The chart below shows the growth of the economy from the first quarter of 2010 to the third quarter of 2013. In the 2010 Budget, the Government expected that the economy would grow GDP by 9.6% between 2010 Q1 (First Quarter) and 2013 Q3 – in fact, growth was less than half of that expected at 4.0%.
2. The failure to rebalance
The Government argued that it would rebalance the economy towards business investment and exports.- It has failed. As shown in Chart 2, these components of aggregate demand have not only failed to add to growth, they have acted as a drag on the economy as firms have not invested because of the depressed economy and exporters have failed to penetrate overseas markets. The biggest contribution to growth since 2010 was consumption – fuelled by low interest rates and by house-price inflation (mainly in London and the South East).- It is dangerous – if not reckless – to rely on those sectors of the economy that caused the crisis to fuel the recovery.
As Chart 2 shows, the government sector also made a small contribution to growth. This may seem paradoxical in a period of austerity. But it is explained by fiscal stabilisers – when a government cuts discretionary spending, such as public investment, this slows the growth of the economy which then leads to a decline in tax revenues and an increase in welfare payments which tend to dampen the negative impact of the initial policy change.- This also helps to explain why the Government has consistently failed to hit its deficit targets.
3. Not all in it together
The crisis started in the financial centres of the world. But it quickly spread to regions and cities around the world. In the UK, some of the hardest hit places were the depressed regions and slow growing cities. And the recent return to modest growth has been concentrated in London and the surrounding regions in the south of the UK. Chart 3 shows how employment rates have changed since the recession: London is the only region with a higher employment rate in 2012 Q4 than in 2007 Q4.
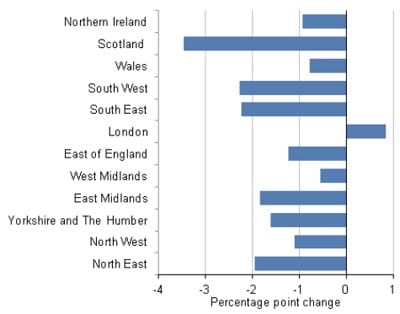
Source: ONS, Regional Economic Indicators, March 2013
4. No strategy for long-term growth
Both the Government and the Opposition have failed to develop any vision of the future path of economic growth. Instead the focus is on short-term political machinations – such as who can cut fuel prices and be the toughest on immigration (which includes the inflow of students – one of the UK’s few successful trade sectors). Even without such a vision, growth will return – but it will be lower than the potential of the economy, and the UK will be continue to be overtaken by countries that have a strategy for growth.
Michael Kitson is Director of the Management Studies Tripos; Deputy Director of the MBA Programme; University Senior Lecturer in International Macroeconomics; Hub Director of the UK-Innovation Research Centre and Assistant Director of the Centre for Business Research (CBR)